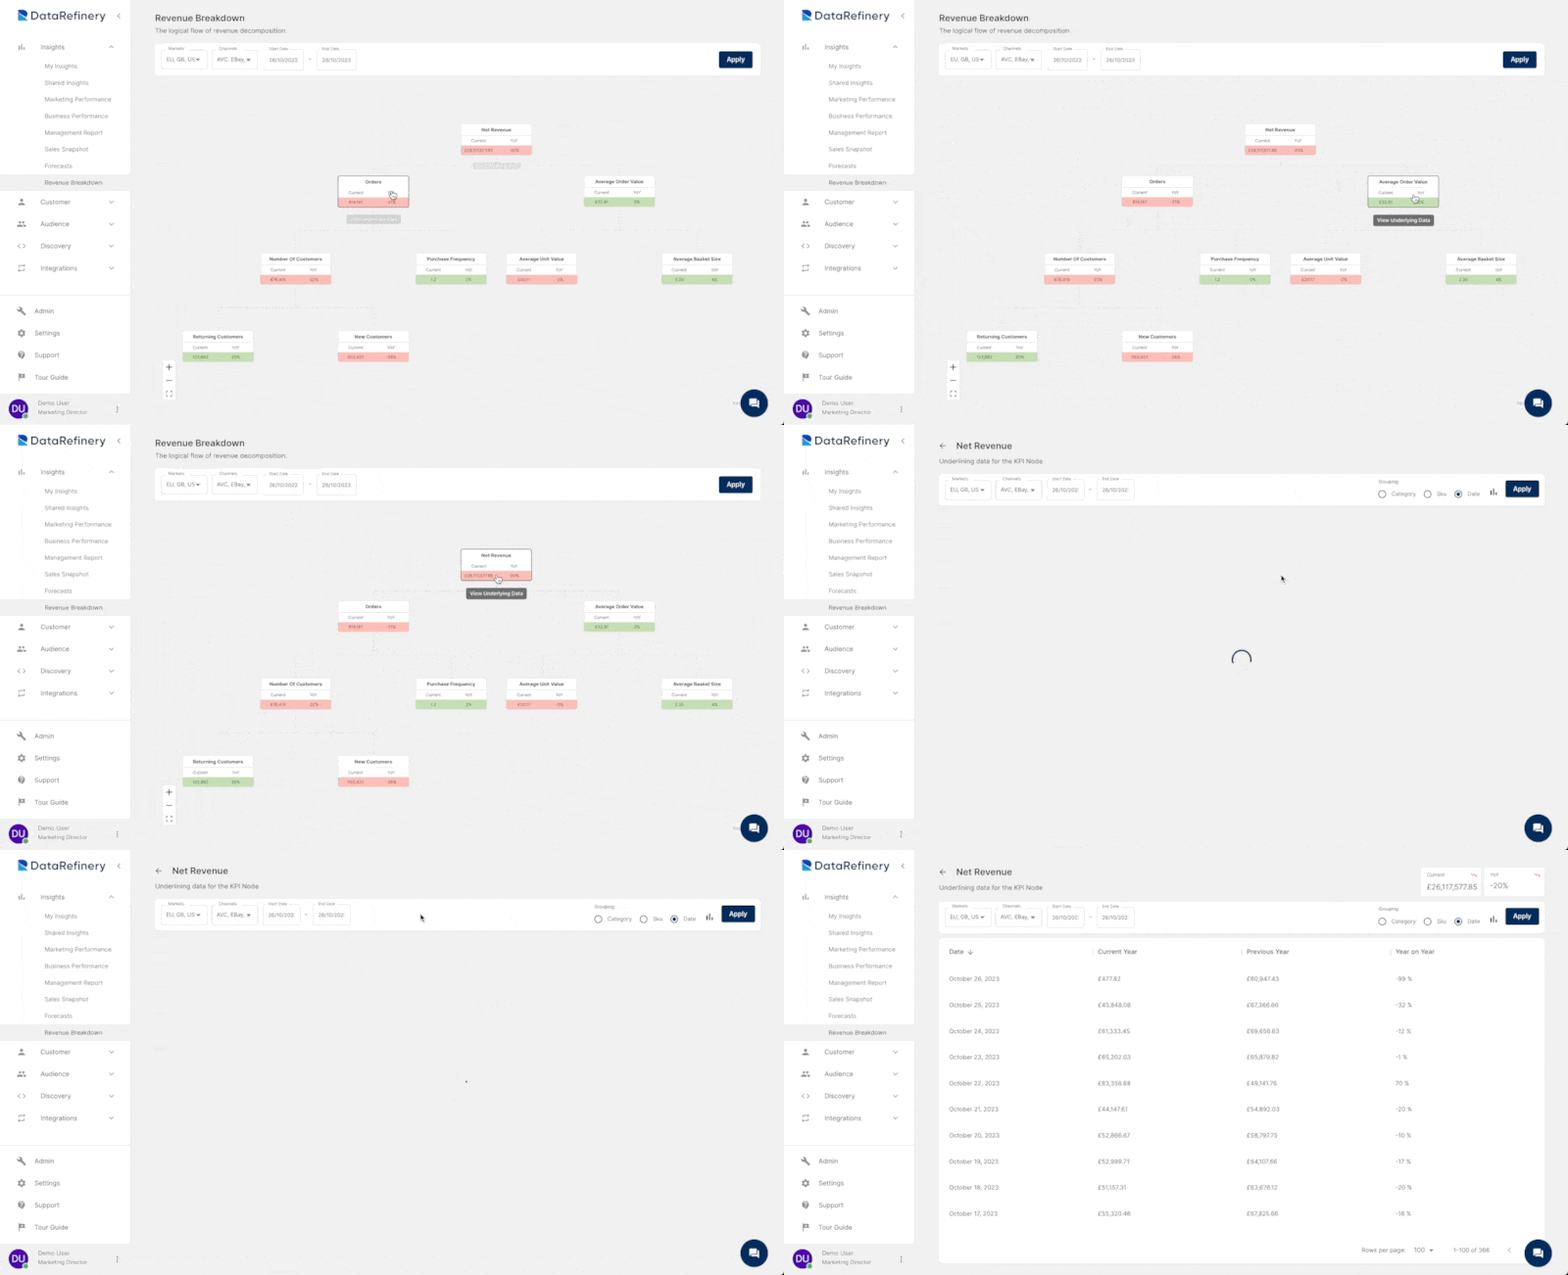
Revenue Breakdown
This report illustrates the logical flow of revenue decomposition within your organization. It provides a comprehensive visualization of revenue distribution, breaking it down into components such as orders, number of customers, and average basket size. The report presents this information in a tree-like diagram, where each property is depicted in its own block. Users can drill into each block to view its underlying data. Visualising the data as a table or chart.

Additional Notes:
Clicking on a Revenue Breakdown node will reveal its underlying data. From here, you can filter the data by Markets, Channels, and Date. Groupings can also be applied to specific categories, SKUs, and dates. If necessary, the underlying data can be displayed in a chart.