Marketing Performance
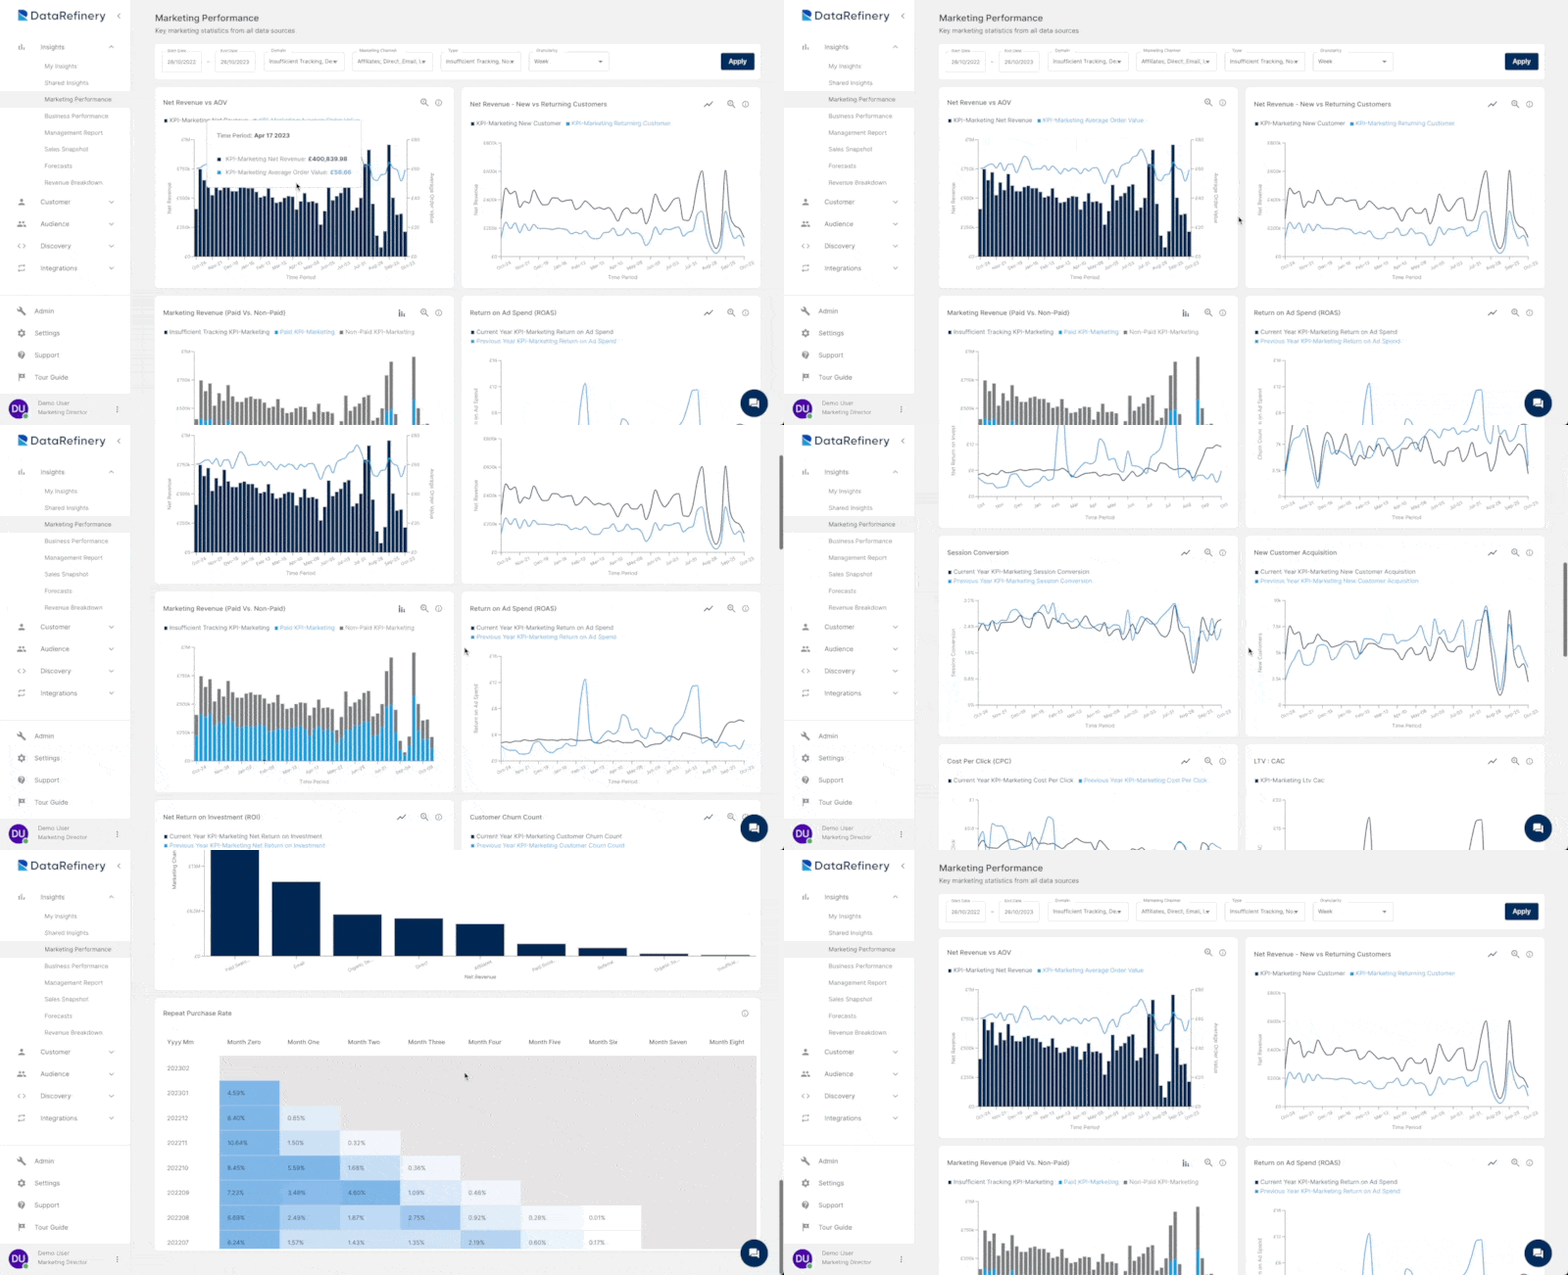
This report give valuable insights into your marketing strategies. Discover which marketing channels generate the highest revenue for your business. Understand your cost per click rate, evaluate the expenses associated with customer acquisitions, and uncover many more essential metrics to optimize your marketing efforts effectively.

Marketing Report Charts
Marketing reports gives you a 13 Charts covering all things Marketing:
| Metric | Description |
|---|---|
| Net Revenue Vs AOV | Associated to marketing activity versus the average net order value of those orders. |
| Net Revenue - New vs Returning Customers | Associated to customers making their first purchase versus those who have previously made purchases. |
| Marketing Revenue (Paid Vs. Non-Paid) | Gross order revenue split between paid and unpaid marketing sources. |
| Return on Ad Spend (ROAS) | The ratio between the net revenue associated with paid marketing activity divided by the cost for the activities. For every £1 spent on marketing activity, £X was returned through net revenue. |
| Net Return on Investment (ROI) | A more generalized view of ROAS including net revenue from non-paid marketing sources such as organic. ROI represents the ‘total net return’ on marketing. |
| Customer Churn Count | The count of customers reaching 90 days without making another purchase (i.e. the number of customers that have ‘churned’). |
| Session Conversion | The proportion of individual sessions on your website that led to an order. |
| New Customer Acquisition | The count of customers making their first purchase in a given time period. |
| Cost Per Click (CPC) | The sum of AdCost for all PPC channels divided by the number of clicks across all PPC channels made in a given time period. |
| LTV : CAC | Lifetime value (LTV) is the average value a customer brings to the company in their first year of transacting versus the average cost of acquiring that customer (CAC). The result is a ratio of LTV to CAC that answers the question “for every £1 spent acquiring a cohort of customers, the company made £X in their first year of transacting. |
| Untracked Orders | The volume and proportion of orders in DimOrder that are not linked to a GA ID. Large spikes in un-tracked orders could be an indication of a systemic problem. |
| Net Revenue by Marketing Channel | The net revenue by different marketing channels. |
| Repeat Purchase Rate | The proportion of the cohort making purchases in a given month that go on to make another purchase in the subsequent months. Cohorts can be filtered by Store, Marketing Channel, and Paid Marketing. |
Additional Notes:
Users have the ability to perform the following actions on each chart:
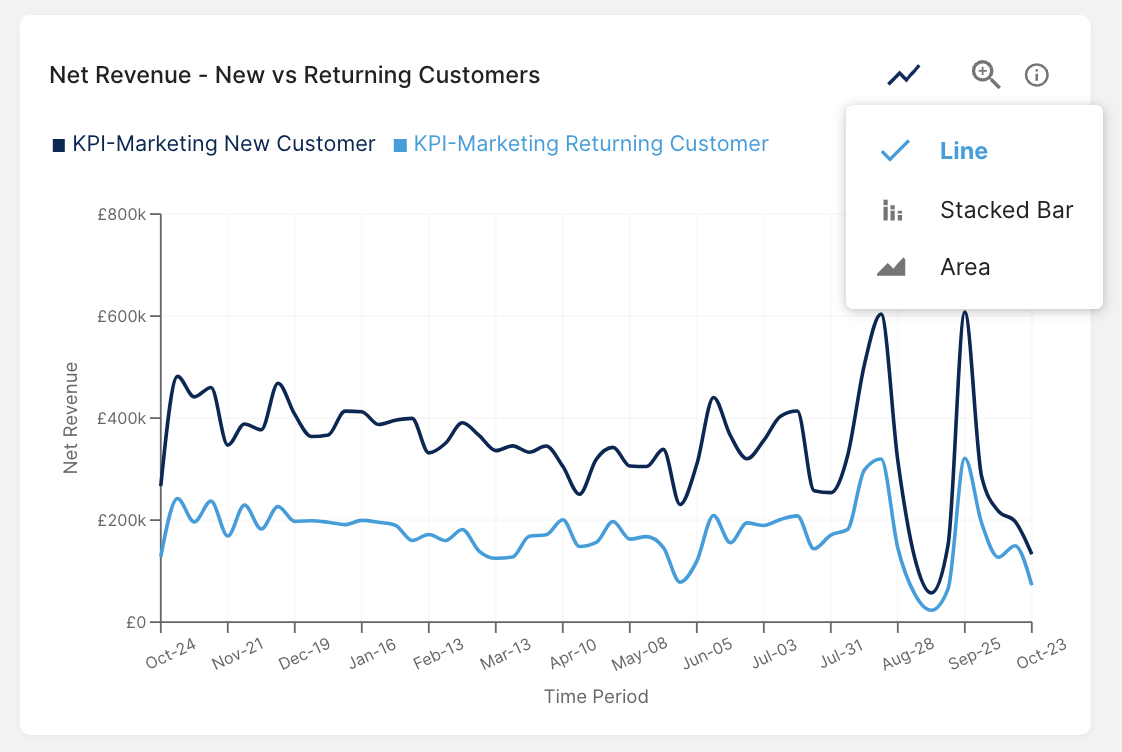
Change Chart Type
By clicking the chart icon, you can switch the displayed chart type to another format. For example, a Line Chart can be transformed into an Area Chart.

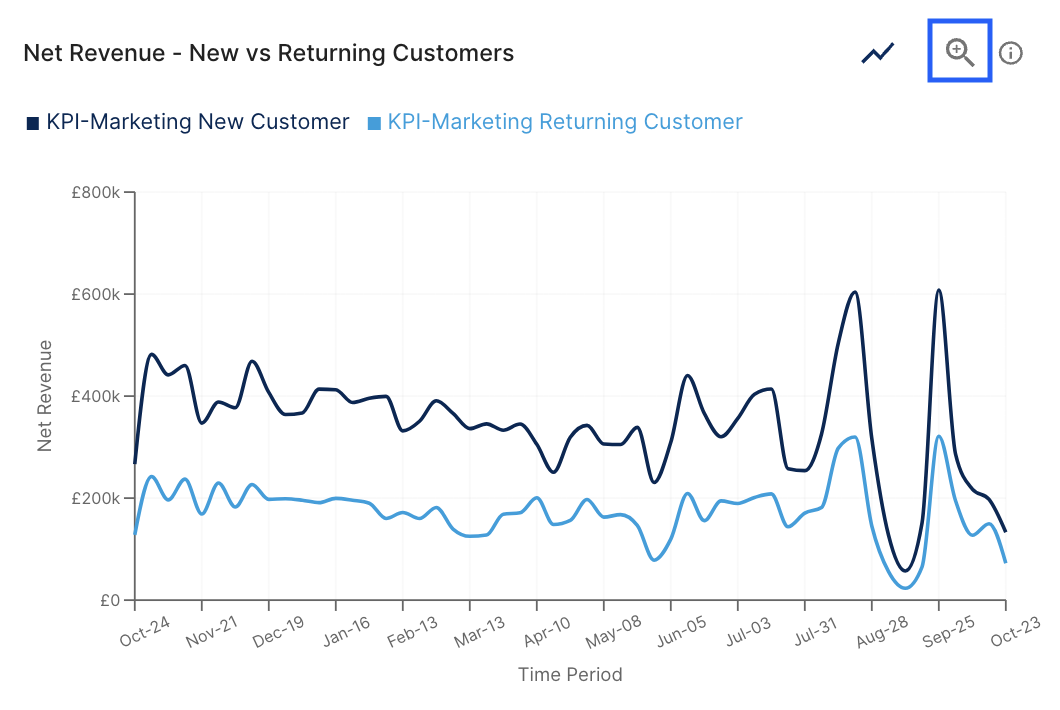
View Underlying Data
Clicking the zoom icon redirects you to the underlying data view. Here, you can choose to view the chart in an enlarged format or explore the underlying data in a table.
 "
"